

"Dark Heat" and Earth's Energy Imbalance
The Rate of Change: July 23, 2019
To understand why global warming happens, we need to think about Earth’s energy balance.
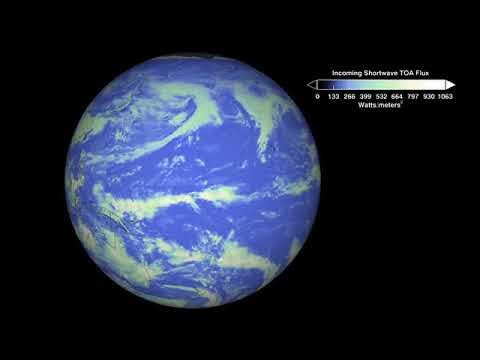
Here’s a map of the incoming solar energy that Earth receives.
The blue stuff is the energy that reaches the surface, and the bright white spots are either clouds, snow, or ice, which reflect the Sun’s light and shade our planet.
If this was the end of the story, we’d keep getting hotter and hotter, with no limit (although I know it might feel like that these days). Somehow, we also need to get rid of all this energy.
The way we do this is by glowing with invisible light, through what the mathematician Joseph Fourier poetically called ‘dark heat’ (or rather, he called it chaleur obscure, because he was French).
Today, we use the rather less poetic term infrared radiation. Climate scientists sometimes refer to this as our ‘outgoing longwave radiation’. But don’t let the names confuse you. We absorb visible light and we emit dark heat.
If a thing gets hot enough, like lava, or the red-hot embers after a fire, then the heat becomes so intense it’s no longer dark. It leaks into the visible range. But on average, Earth’s relatively moderate temperature is safely inside the range of dark heat. (Interestingly, although this heat is dark to our eyes, it’s visible to heat-sensing snakes.)
Here’s what this dark heat looks like, as seen by satellite. This is Earth’s invisible glow.
Seen from this high view, clouds obscure Earth’s heat and show up as blue or white cold spots. That’s because, in addition to their role in providing shade, clouds can also act like a blanket, trapping our heat and keeping the Earth warm.
Clouds are complicated. When it comes to incoming solar energy, they cool us down with their shade. When it comes to our outgoing heat energy, they warm us up with their blanket-like behavior. (Or as a physicist might say, clouds are white in visible light but act as black bodies in the infrared spectrum).
Which of these wins out — cooling or warming — has to do with the specifics of the type of cloud. So to predict future climate, scientists have to model the nitty-gritty details of how clouds will form in the future. This is one of the big reasons why climate predictions are hard.
But let’s take a step back and talk about temperature.
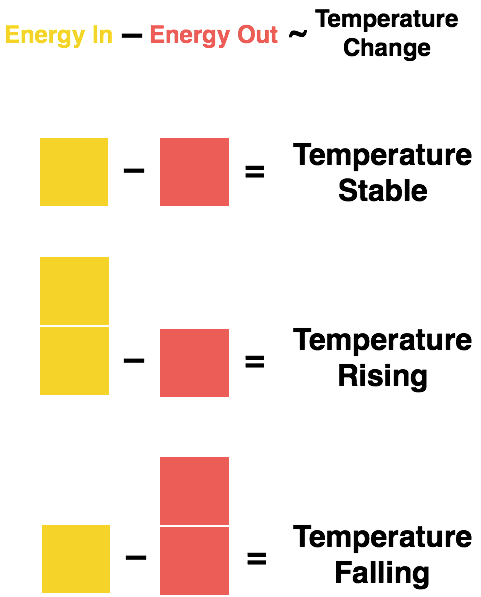
For Earth’s temperature to be stable, the incoming energy from the Sun needs to exactly balance the outgoing dark heat. Any imbalance means that we’re either heating up or cooling down.
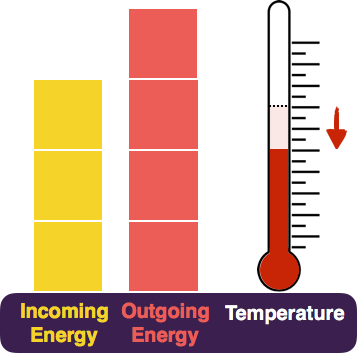
Here’s an oversimplified but instructive cartoon model. Let’s think of these yellow blocks as representing the energy that we get from the sun. The red blocks symbolize our dark heat. And the thermometer measures our temperature.

All these numbers represent global average quantities, so the numbers are averaged over the entire planet. In the picture above, the two energy piles are perfectly balanced and cancel each other out. So, our temperature remains stable.
Now, let’s say we add a block of energy to our incoming pile. This could happen through the greenhouse effect, or it could happen if the Sun grew considerably brighter (as ours is scheduled to do over billions of years). We then end up with a picture like this.

So now we’re absorbing more energy than we’re radiating. That’s going to raise the temperature.

But there’s a puzzle hidden here. If we’re gaining more energy than we lose, why don’t we keep getting hotter forever? What stops this energy imbalance from incinerating the planet?
The answer comes from basic physics. When you look at things with a thermal camera, you see that as a a thing’s temperature rises, it glows more brightly with invisible, dark heat. I mean, just take a look at how this Pomeranian emits heat!
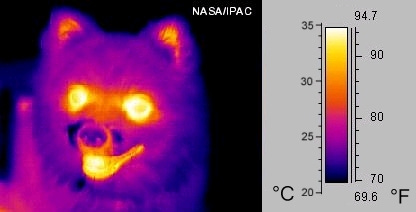
Image: NASA/IPAC, modified by Wikipedia
In the nineteenth century, scientists worked out the exact relationship between an object’s temperature and its heat glow. (As a historical side note, explaining this law won Max Planck a Nobel Prize and led to the birth of quantum mechanics.)
You can see this bright glow in this NASA satellite image of the invisible heat energy radiated by the Earth during the 2003 European heatwave.

So as our temperature rises, our dark heat emissions rise with it. And so the red pile also starts to grow, until it balances the yellow pile. Once this happens, the Earth’s temperature stabilizes at its new, hotter level.

(Why does the temperature stabilize? If the red pile overshoots the yellow, we’ll start losing more heat than we gain, which will cool us down, lowering the temperature and therefore also the red pile. So this is a self-stabilizing mechanism.)
It all comes down to simple physics: if we gain more energy than we lose, we warm up.
This process also works in reverse. Imagine if our Sun were to somehow get dimmer. This can happen in the aftermath of a massive volcanic eruption, like the Mount Pinatubo eruption in 1991, which caused global temperatures to drop by nearly half a degree Celsius in a single year. Some of the more extreme geoengineering proposals seek to emulate this idea by releasing particles into the atmosphere to dim the Sun.
In our cartoon picture, this will take away a block of incoming solar energy.

So now we’re losing more energy than we gain from the Sun. You know what comes next. We get colder.
And as Earth’s temperature drops, our dark heat glows dimmer. That red bar starts to shrink until eventually, we end up back in a balance, and the temperature stabilizes into a lower level.

So, to understand where Earth’s temperature is going, we need to understand our planetary energy balance.
If there’s a positive imbalance (energy in minus energy out), we’ll warm up, until we reach a new, hotter balance. If the imbalance is negative, we’ll cool down. And if it’s zero, then Earth’s global thermometer won’t budge.
So, what is our energy imbalance? It turns out that we understand this very well. Climate scientists refer to this energy imbalance — the difference between the yellow and the red piles — as Earth’s radiative forcing.
Let’s talk numbers.
Our incoming solar energy averaged over the Earth’s surface is about 240 W/m², or 240 Watts / square meter. (Working out this number starting from the temperature of the Sun turns out to be a fun physics exercise.. I can feel you judging me right now).
If this were the only source of incoming energy, our planet would be way too cold. You can calculate that without any greenhouse effect, Earth’s average temperature would be -18 degrees Celsius, or about zero Fahrenheit! (This numerical coincidence is also the only redeeming feature of the Fahrenheit scale.)
So without any greenhouse effect, Earth would be a frozen rock. The greenhouse effect at pre-industrial levels effectively increased our incoming energy and warmed us up. You can think of this like adding to the yellow blocks in the picture above, which raised the Earth’s temperature, until the red blocks grew to catch up, and we settled into a warmer temperature balance.
That was 1750. Where are we today? Here’s a chart from page 14 of the 2013 IPCC report on the science of climate change. (Click to enlarge)

This figure tells us Earth’s energy imbalance in 2011 (or as climate scientists call it, Earth’s radiative forcing), as compared to 1750. It also tells us the contributions from different greenhouse gases. Unsurprisingly, the biggest contributor is carbon dioxide.
After adding up all the pieces, the report finds that Earth’s energy imbalance due to human causes is roughly 2.3 W/m². This is how much we’ve added to the yellow blocks since 1750.
What does this number mean? One way to think about it is to remember that we receive 240 W/m² from the Sun, and 2.3 is nearly a percent of 240. In other words, human-caused changes have increased our incoming energy by an amount roughly equivalent to the Sun getting brighter by one percent.
To be clear: I’m not saying the Sun became one percent brighter — I’m saying that between 1750 and 2011, the amount by which we’ve heated the Earth is as if we instead made the Sun a percent brighter.
For comparison, how much did the Sun’s brightness actually vary in that time period? The chart above tells us that this number is 0.05 W/m². Comparing this to 240 W/m², we find that this is a 0.02% variation in the Sun’s brightness — nearly 50 times smaller than the human-caused component.
This is how we know that global warming is human-caused.
So, today, we’re out of balance. We know that the yellow blocks exceed the red. And basic physics tells us that when there’s more energy going in to a box than there is leaving it, the box will warm up.
What’s more, the imbalance is growing. In 2011, it was about 2.3 W/m². The IPCC considers four different scenarios for how this number will grow by 2100. These Representative Concentration Pathways go by the names RCP2.6, RCP4.5, RCP6, and RCP8.5 (we encountered these pathways in an earlier newsletter). The numbers following RCP aren’t temperature changes, but are instead the energy imbalance in 2100, compared to pre-industrial levels.
So in 2100, we’re looking at an increasingly unlikely best case energy imbalance of 2.6 W/m², and a nightmarish worst case of 8.5 W/m². To get a better sense of what these numbers mean, just compare them to our incoming solar energy, which is 240 W/m². An energy imbalance of about 8.5 W/m² in 2100 would have an equivalent effect on temperature as the Sun becoming ~3.5% brighter than it was in 1750.
How much will we warm up?
We know that Earth’s energy has a positive imbalance — there’s more energy coming in than leaving. We know this will lead to an increase in Earth’s temperature. None of this is in any scientific dispute, as it relies on fundamental, well-understood principles of physics and chemistry. The mathematician and physicist Joseph Fourier first described this mechanism way back in 1827, and the theoretical and experimental details were well understood in the latter half of the 1800s.
Here’s the hard question. Exactly how much will our temperature increase?
The relationship between energy imbalance and temperature increase is known as Earth’s climate sensitivity. The climate sensitivity tells us how much Earth’s average temperature will increases when our energy imbalance increases by 1 W/m². In our cartoon picture above, it tells us how the thermometer responds to adding a yellow block. A high climate sensitivity means that a small energy imbalance will result in a large change in temperature.
In coming newsletters, we’ll dig into how we know what this number is, why predicting it is so hard, and we’ll add some more complexity to our simple cartoon picture of the Earth.
This Week in Climate News
French senators have approved a bill setting France on a new target to reduce greenhouse gas emissions and go carbon-neutral by 2050. (via @Sustainable2050)


Amid Heat Wave in New York, 50,000 Lose Electricity
How extreme weather leads to contamination that causes people to fall sick


I was using this real-time electricity map to track the carbon intensity of energy in New York, where I live. During the heat wave, the intensity peaked at well over 300 gCO2/kWh, whereas today is cooler and we are down to about 250 gCO2/kWh (which is still twice the annual average). As the map shows, the reason for this shift is the amount of natural gas we’re consuming, which ramps up during a surge in demand.
Why climate change is a human rights issue
In a report presented to the Human Rights Council on Friday, U.N. special rapporteur Philip Alston writes that climate change is an “unconscionable assault on the poor.”
Via @YaleClimateComm
In 2018, the carbon dioxide emissions of the US’s energy sector grew by 2.7%. According to the US Energy Information Administration, this is expected to dip down in 2019. The reason for this is falling coal use, which is being replaced by natural gas. Via @Peters_Glen


An incurable and progressive disease, chronic obstructive pulmonary disease moved up from the eighth spot to become second on the list of leading ways to die in India, over 26 years to 2016 – the year for which the latest data are available. Chronic obstructive pulmonary disease claimed more victims than either road accidents or suicides in 2016. It claimed more lives than diabetes, malaria, tuberculosis and breast cancer combined in 2016.
Via @airqualityindia


Heat Waves in the Age of Climate Change: Longer, More Frequent and More Dangerous
If you missed this interactive from last year, it’s worth checking out. How much hotter is your hometown than when you were born?


In the Indian state of Assam, nearly 4.3 million people have been displaced by floods and more than 100 people have been killed. Via @AmbaAzaad


France’s record-breaking heatwave made ‘at least five times’ more likely by climate change


Earth just had its hottest June on record, on track for warmest July (via @DrJoeHanson)


Flooding Kills Dozens in Nepal as Waters Rise Across Asia


Why Brazil's deforestation of the Amazon is a matter of international responsibility
Deforestation of the Amazon rainforest in Brazil is at its highest rate in a decade, according to new satellite data. This comes after president Jair Bolsonaro has loosened environmental regulations, cut enforcement budgets, and supported further development in the region.
Trees absorb carbon dioxide naturally, and are one of best tools we have to help stave off climate catastrophe – and the Amazon itself is a crucial carbon sink. This means responding to deforestation in Brazil has become a matter of international responsibility.


In 1856, Eunice Foote became the first person to discover that carbon dioxide is a greenhouse gas


Why history forgot the woman who discovered global warming
The female scientist who identified the greenhouse-gas effect never got the credit
Pretty much every reference I’ve read credited John Tyndall for the discovery that carbon dioxide is a greenhouse gas. However, Eunice Foote’s work on carbon dioxide preceded John Tyndall’s work by three years and identifies it as a greenhouse gas. Tyndall did not cite her work, although it’s unclear if he was aware of it. However, he was one of the five editors of the journal in which she published her work, and he published an unrelated article in the same edition of the journal in which she published. So it’s a bit surprising (to put it mildly) that he would be entirely unaware of her work.
That’s all for this week, see you next week!