


The Rate of Change: July 15, 2019
Millennia from now, if there’s one piece of data that humans alive today will be known for, I think it would be this.
Carbon Dioxide Levels over the Past 10,000 Years

Image modified from the Keeling Curve
This graph shows us the historical record of carbon dioxide levels in Earth’s air, over the last 10,000 years. For most of this time, carbon dioxide levels were quite stable — that’s the relatively flat portion of the graph. Agriculture, cities and civilizations all got their start somewhere along those gentle slopes. This stability coincided with the moderate climate following the last ice age, which ended around 15 thousand years ago.
All the way on the top right, that dramatic spike is where we find ourselves today. The last time that carbon dioxide levels were as high as they are today was about 3 million years ago. Back then, global temperatures were 3 degrees Celsius warmer, and sea levels were about 20 meters (66 feet) higher.
(This classic XKCD comic explainer provides an excellent timeline of Earth’s temperature from the last ice age to the present day. By taking this long view, we can understand how unprecedented our current moment is.)
You might think that the carbon crisis is a historical problem, because we’ve been burning fossil fuels for hundreds of years. But take a look at this.
Carbon Dioxide Levels over the Past 10,000 Years: a Personal, Human-Centered View

Image modified from the Keeling Curve
Here’s an astonishing fact: humans have pumped more carbon dioxide into the air in my lifetime than in the time between my birth and the start of the Industrial Revolution.
If you look at all carbon dioxide added to the atmosphere since the Industrial Revolution, more than half was added after 1990. A quarter was added after 2007. Just 30 years — a single generation — accounts for half of all carbon emissions in the history of burning fossil fuels.
Here, look up your age in this chart created by Neil Kaye, a climate data scientist at the UK’s Met Office. It’ll tell you how big a slice of global fossil fuel emissions have occurred in your lifetime.
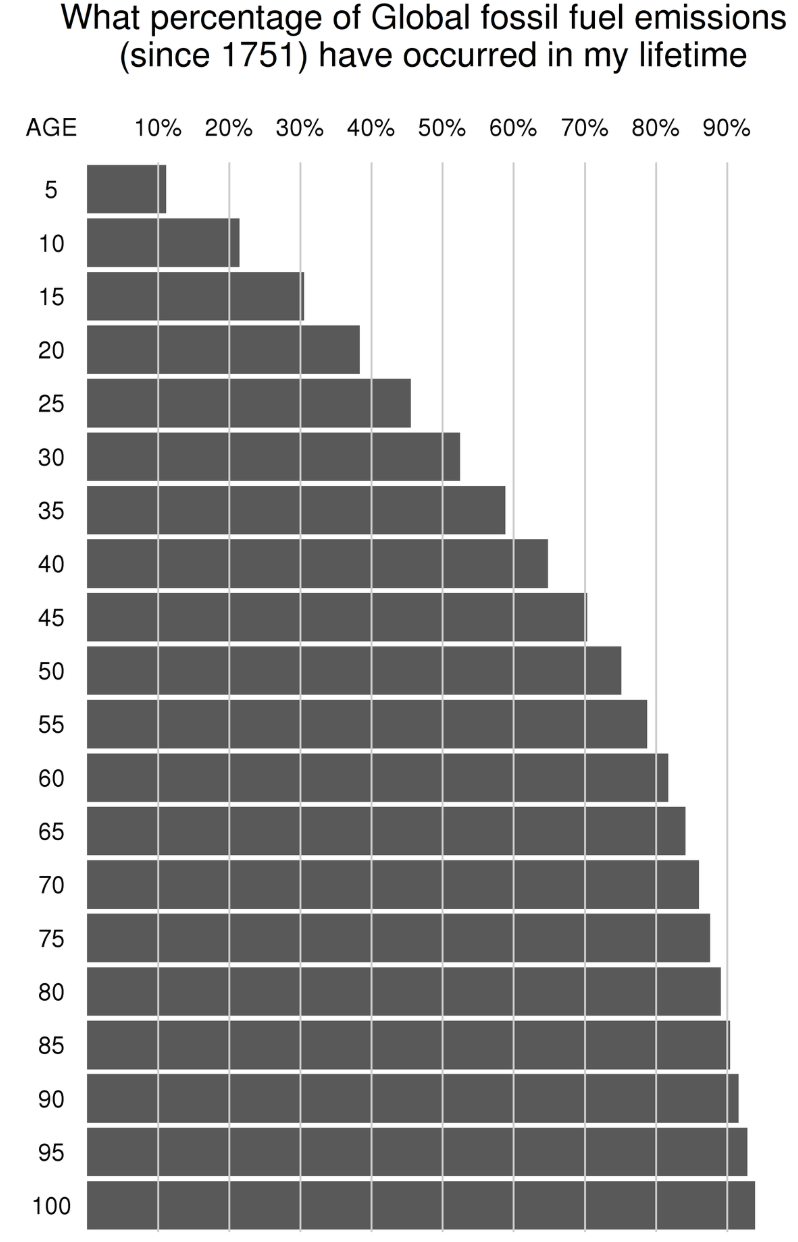
Image source: Neil Kaye, World Energy Data
So this is very much a modern problem.
Let’s zoom in closer to modern times. Here’s all of human industrialization in a graph.
Carbon Dioxide Levels From The Industrial Revolution to Present Day

Image: the Keeling Curve
Around 1750 marks the start of the Industrial Revolution, when humans figured out how to power machines by burning fossil fuels. From then on, our story has been one of accelerating greenhouse gas emissions.
The units of measurement in these graph are parts per million of our atmosphere. As I write this, we’re at about 414 parts per million of carbon dioxide — 0.0414% of the air that we breathe is CO2. The green line marks when we crossed 400 ppm.
Before 1958, the data comes from analyzing air trapped in frozen bubbles deep beneath the surface of Antarctica’s ice (the deeper you drill, the older the ice). From 1958 onwards, the data comes from the Keeling Curve, a detailed record of carbon dioxide levels based on direct measurements at an observatory in Hawaii. The Keeling Curve is one of the most important vital signs tracking the trajectory of our climate, and it looks like this:
The Keeling Curve (as of July 1)

Image: the Keeling Curve
The curve has wiggles in it, corresponding to the annual seasonal cycle. But the overall trend is unmistakably clear. Every year, CO2 levels are rising.
When we eventually wean away from fossil fuels, this curve will start to flatten out. (It won’t move downwards immediately after our emissions stop — carbon dioxide stays in the air even after we stop adding more of it, because it takes a while for carbon to be reabsorbed by the Earth.)
How high this curve reaches will determine Earth’s eventual temperature. So it’s safe to say that this is one of the most consequential turning points in human history.
Footnote: By the way, the ice core data keeps going further and further back. If you look at the last 800 thousand years, carbon dioxide levels fluctuated rapidly, and so did the climate. Every rise and plummet in that graph is associated with a corresponding rise and plummet of global temperatures (it’s possible to infer temperatures of the deep past by analyzing the concentrations of various isotopes). From this long view, all of human civilization is confined to a narrow plateau of climate stability.
The Takeaway
You should know two things about the Keeling Curve, which measures carbon dioxide concentrations in our atmosphere.
First, CO₂ levels are strongly linked to Earth’s temperature.
The climate sensitivity measures how much Earth’s temperature will rise if carbon dioxide levels double. This number is very difficult to calculate because it involves complex feedback loops — as the Earth gets warmer, things like the cloud cover and the ice cover change, which in turn increase the rate at which the Earth is being warmed.
At the moment, climate scientists are confident that doubling CO₂ levels will likely result in a temperature rise of 1.5 to 4.5 degrees Celsius. (This is the temperature rise when the climate settles down into a new balance, which might be centuries after the doubling occurs. The short-term rise in temperature from a CO₂ doubling is likely between 1.5 and 2.5° C.)
The second thing to know about the Keeling Curve is that its slope is rising. With every decade, we’re emitting increasing levels of carbon dioxide. In other words, we’re accelerating our carbon emissions, at a time when we need to hit the brakes.
Three Compelling Ways To Think About the Keeling Curve
Neil Kaye broke down our fossil fuel emissions from 1751 onwards into 4 periods of equal emissions.


Here’s another way to look at this acceleration, by Kees van der Leun:

Finally, Gregor Aisch had the clever idea of wrapping the Keeling Curve around every decade, so you can see how our rate of emissions is changing. (Here’s an interactive version where you can find out the levels when you were born).

In the 1960s, carbon dioxide levels rose at a rate of less than 1 ppm/year. In this decade (2010 onwards), the rise was nearly 3 ppm/year. (As a reference, a rise of 1 part per million corresponds to adding 7.8 billion tons of carbon dioxide to the atmosphere.)
This acceleration of emissions makes climate change a modern problem.
Numbers to Know
A part per million, or ppm, is a standard measure of greenhouse gas concentrations. To convert from ppm to percentage, divide by a million and multiply by 100. So 400 ppm = 400 × 100 / 1,000,000 percent = 0.04 percent.
1 ppm of CO₂ corresponds to 7.81 billion tons of carbon dioxide, which is what you’d get from completely burning 2.13 billion tons of carbon. These three units are often used interchangeably.
1 ppm of CO₂ = 2.13 billion tons of Carbon = 7.81 billion tons of Carbon Dioxide
A billion tons of Carbon can be abbreviated as GtC, and a billion tons of Carbon Dioxide is abbreviated as GtCO₂. A common mistake (I’ve done this a few times) is to confuse GtC and GtCO₂. To go from a weight of carbon to a weight of carbon dioxide, you multiply by 44/12 = 3.67
How to talk to your kids about climate change
Climate scientist Katherine Hayhoe shared how she talks about climate change to children, in this piece by Megan Ogilvie on what we can do about climate change.
“By digging up and burning coal and gas and oil we are wrapping an extra blanket around the planet. And just like we overheat when someone puts an extra blanket on top of us, one that we didn’t need, the planet is overheating and it’s running a fever.”
One in every eight deaths is due to air pollution. Here’s what one person is doing about it.
Excellent interview with Christa Hasenkopf, the co-founder and CEO of the nonprofit OpenAQ, which makes real-time and historical air quality data freely available and easy to access. By Shannon Farley in Forbes.
Oceans are absorbing almost all of the globe’s excess heat
It’s not everyday that you see the word ‘zettajoules’ in a New York Times article. Tim Wallace reports. (via Dr. Ayana E. Johnson)

“Since 1955, more than 90 percent of the excess heat retained by the Earth as a result of increased greenhouse gases has been absorbed by the oceans, leaving ocean scientists like Eric Leuliette at the National Oceanic and Atmospheric Administration feeling that 90 percent of the climate change story is being ignored.”
The climate crisis in a tweet


The data comes from this source.
Here’s a depressing statistic from the same source.
“A measure of decarbonisation is the carbon intensity of total primary energy supply, which is a measure of the quantity of carbon dioxide emitted for every [unit] of energy supplied. Chart 9 shows there hasn’t been any significant decarbonisation of the world’s energy supply. The curve is almost flat.”
Here’s that curve for you.
The World’s energy hasn’t gotten cleaner since 1990
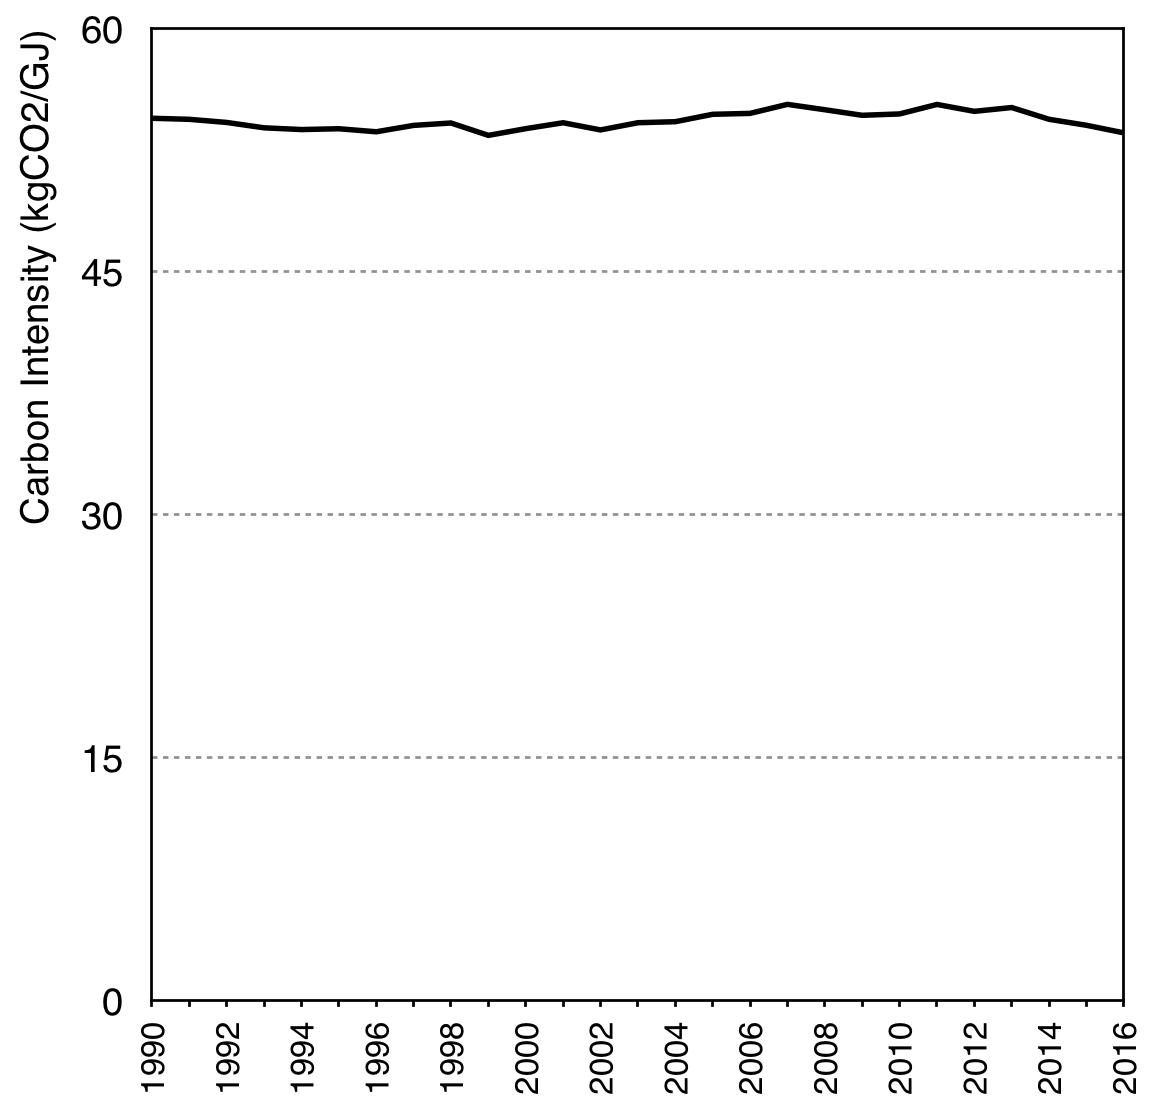
Yup, pretty flat alright.
As a whole, our global energy supply hasn’t gotten cleaner since 1990. However, our energy use has increased, and so our emissions follow along.
Calling plantations ‘forest restoration’ is putting climate targets at risk
By Simon Lewis and Charlotte Wheeler, in The Conversation.
“Of all the negative emissions technologies available, allowing natural forests to return is safe, often not costly, and brings many other obvious benefits. But forest restoration can only play the critical role that it needs to if it means the same thing to policy makers as it does to everyone else: restoring areas back to largely intact largely natural forest. A new definition of “forest restoration” that excludes monoculture plantations is needed.”
Los Angeles struck a deal on the largest and cheapest solar + battery-storage project in the world
Jeff McMahon report in Forbes. (Via Akshat Rathi)
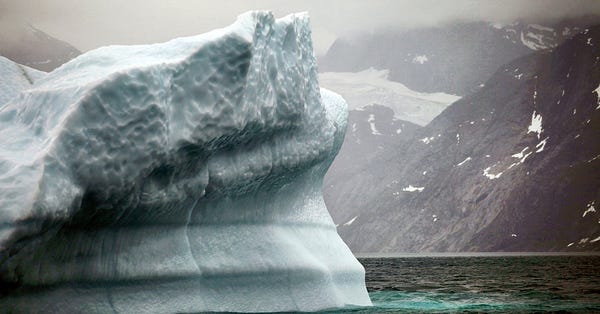
To understand climate change, we need to understand Greenland
This new book looks worth a read.

Rising seas imperil the cables and power stations that power the internet
By Alejandra Borunda in National Geographic. This was an interesting thread about this issue.


What you can do about climate change
An excellent twitter thread by Rosemary Mosco.

On the emotional toll of climate work
David Corn wrote the recent Mother Jones cover story on the distinct burden of being a climate scientist. (Via Dr. Katherine Wiklinson)
The psychological toll of working as a climate scientist
On The Media’s Brooke Gladstone interviews David Corn, author of the piece above, and speaks with Priya Shukla, Ph.D. candidate at UC Davis.
On Air Pollution in America
Nadja Popovich reports in the New York Times.
Fact checking Trump’s claims on Air Pollution
By Robinson Meyer in the Atlantic.
One climate crisis disaster happening every week, UN warns
“Climate crisis disasters are happening at the rate of one a week, though most draw little international attention and work is urgently needed to prepare developing countries for the profound impacts, the UN has warned.”
Fiona Harvey reports in the Guardian. Via Carl Zimmer.
Ancient life awakens in thawing permafrost
Thankfully, it’s just 1,500 year old mosses. For now. By Diane Ackerman in the Washington Post. Via Deborah Blum.
On the role of alarm in climate communication
By Marc Tracy in the New York Times.
Storks are making a comeback in Britain
By Isabella Tree in the Guardian.

Why you should talk about climate change
Excellent piece by Julia Rosen in LA Times.


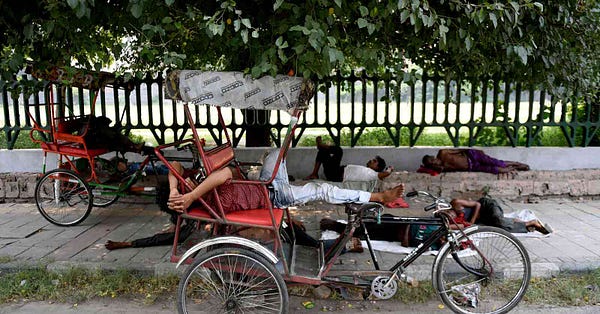
What Delhi’s future holds
By Nilanjana Roy in the New York Review of Books. (Via Hari Kunzru)

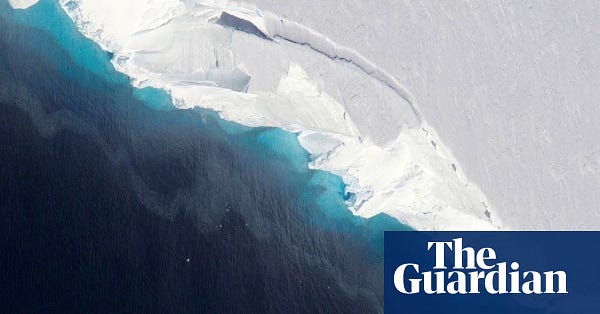
The melting of Antarctica’s glaciers is accelerating
By Adam Morton in the Guardian.

24 governors call on Trump to halt rollback on rules for clean cars
By Hiroko Tabuchi in the New York Times.
What can I do about climate change? Resources for school workshops
This looks like a great resource, by Rebecca Willis.
Alaska’s Historic Heat Wave
Parts of Alaska experienced temperatures in the 30s Celsius (or 90s F), breaking all time records.

Image: NASA Earth Observatory
UK emissions cuts must accelerate to meet its target of net-zero emissions by 2050
Although the UK has been reducing its emissions, it is currently falling short of its legally binding target. Simon Evans reports for Carbon Brief. Akshat Rathi also covered this story at Quartz.
Young Activists Are Planning National Protests To Push Democrats On The Climate Crisis
By Zahra Hirji in Buzzfeed News.
Plastic has a big carbon footprint, but so do many of its alternatives
Christopher Joyce reports for NPR’s All Things Considered.
In maps: How Chennai grew over its lakes
By Teja Malladi & Kaavya Kumar in Scroll.in
Life in a City Without Water: Anxious, Exhausting and Sweaty
By Somini Sengupta in the New York Times.
It’s not just you.

That’s all for this week. See you next week!
Your feedback
This newsletter is an experiment, and I’d love to hear what you think. Are there questions that you’d like answered? What would you like to see more of? What works & what could I do better? Let me know your thoughts by replying to this email.
Tell a friend
If you enjoy this newsletter, one helpful thing you could do is tell one friend about it. It really helps get the word out!