Visualizing Greenland's Melting Ice
No Olympic-Sized Swimming Pools Were Harmed in the Writing of This Post
According to a new study, the Greenland ice sheet lost a record-breaking (and intuition-defying) 532 billion tonnes worth of ice in 2019. The Greenland ice sheet refers to the ice covering Greenland, which makes up the second largest body of ice in the world after the Antarctic ice sheet.
As I mentioned in the previous newsletter, Greenland’s melting ice is a Big Deal because it’s the single largest contributor to rising sea level. 2019’s melt alone is sufficient to raise global sea levels by 1.5 millimeters, enough water to hypothetically cover the state of California to a depth of 4 feet.
As climate scientist Andy Shephard told BBC News, “If Greenland's ice losses continue on their current trajectory, an extra 25 million people could be flooded each year by the end of this century.”(If all the ice in the Greenland ice sheet were to melt, it would raise global sea levels by about 7 meters, or 24 feet, although this would take centuries to occur.)
The ice is lost mainly through melting on the surface, as well as through ice at the edge of the sheet either falling into the ocean or melting underwater. Since the early 2000s, NASA satellites have made detailed measurements of Earth’s gravitational field, which allows scientists to effectively weigh different parts of the Earth.

The graph above shows last year in the context of the past two decades of ice loss. The vertical axis shows Greenland’s lost mass in billions of tonnes. Each year there’s a large drop in summer, followed by a small recovery in winter as snowfall accumulates.
Because the summer ice loss exceeds the ice gained from winter snowfall, we end up with this staircase-like graph. The drop in 2019 was larger than any preceding it, and the rate of melting is accelerating.
Lately the steps in this staircase have been getting larger, as Arctic temperatures have risen by nearly twice as much as global temperatures have in the past century. And climate models project that Arctic temperatures will rise two and a half times faster than temperatures at the tropics, so we can expect this trend to continue at least as long as our carbon emissions do.
Making Sense of Giant Numbers: A Guide for the Perplexed
But what does 532 billion tonnes of ice even mean? We might never be able to fully grasp numbers this large, but that doesn’t stop us from trying.
And it’s important that we make the effort, because climate science is all about planetary-scale forces that stretch our intuition. To understand the scale of these forces, we need to develop our intuition for large numbers.
So in this post I’m going to walk you through how I wrap my head around large numbers, and give you some pointers to help you make sense of these gigantic numbers yourself.
Strategy 1: Convert Unfamiliar Units Into Familiar Ones
This is a good problem-solving strategy in general — when faced with something you don’t understand, try to connect it to things you do understand.
Greenland lost 532 Gigatonnes (Gt for short) of ice in 2019. Theoretically, I know what a ‘Gigatonne’ is. A tonne is a thousand kilograms, and giga means a billion, so a Gigatonne is a thousand billion, i.e. a trillion kilograms.
But I have no intuition for how big that is. Instead, here’s something I do have an intuition for: 1 cubic meter. That’s just a box 1 meter long, 1 meter wide, 1 meter tall. You could build one yourself from PVC pipe (have I mentioned my enduring fondness for PVC pipe?) Or you could build one out of meter sticks, like this group of math teachers did.

So let’s convert the unfamiliar unit — 532 Gigatonnes of ice — into the familiar unit of cubic meters (m³). To convert a mass (kg) of ice into a volume (m³), we need to know the density of ice. Wikipedia tells me this is 917 kg/m³.
As a check, I happen to know that the density of water is 1000 kg/m³ (i.e., a cubic meter of water weighs a tonne). If you look at an ice cube floating in a glass of water, you’ll notice that roughly 90 percent of the ice is submerged. This teaches us that the density of ice should be ~90% the density of water, so the number above checks out. (Mini-tip: whenever possible, do a quick intuition check. It’ll pay off in the long run.)
Back to Greenland’s lost ice. If we divide the ice’s mass by its density, we’re left with its volume.

So Greenland lost 580 billion cubic meters of ice in 2019.
This is progress, although it might not seem like it. I might understand what 1 cubic meter looks like, but I certainly don’t have an intuition for billions of cubic meters.
Strategy 2: Tap Into your Geographical Intuition
Let’s work with what we’ve got. I live in New York City, so I have a basic sense for how much land there is in Manhattan. Maybe you do too?
Why not tap into this intuition, and see if we can use it to understand Greenland’s ice. If Manhattan doesn’t work for you, try to find a local geographical area that you’re familiar with instead.
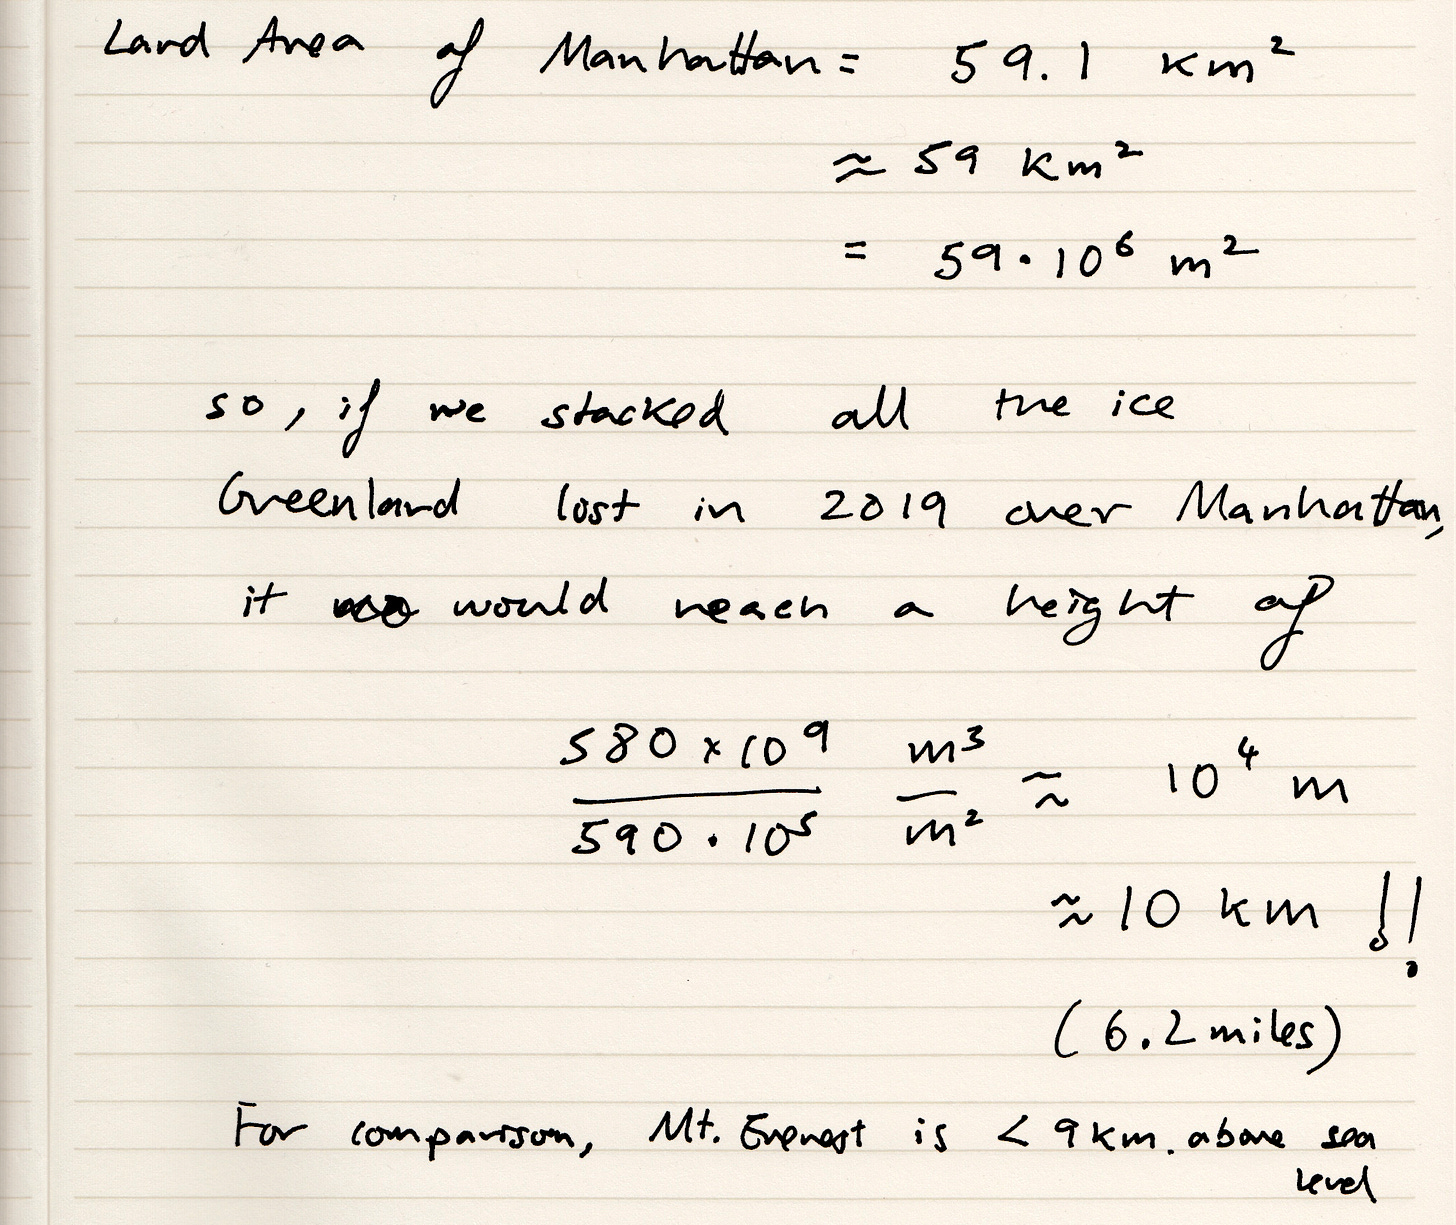
Wikipedia tells me that the land area of Manhattan is about 59 square kilometers (km²), or 59 million square meters (m²). Here’s what I want to know:
If we stacked all the ice that Greenland lost in 2019 over Manhattan, how high would it reach?
If I had to guess, I’d say the answer might be on the order of 100 meters (roughly 30 stories high). Maybe you have your own guess for what you think the answer should be? It’s helpful to explicitly articulate these guesses, even if it’s just based on a vague feeling, because it gives you a sense for whether the actual answer is surprising.
Here’s a map of Lower Manhattan.

And here’s what my guess of a 30 story (100 m) tall ice sheet looks like.

When zoomed out, my guess looks like this.

OK, now let’s crunch the numbers.
If we divide a volume by an area, we get a height (m³/m² = m). So dividing 580 billion cubic meters by 59 million square meters, I get an answer of 10 thousand meters, i.e. 10 kilometers (a little over 6 miles).

(Another mini-tip: if two numbers are close, you can treat them as equal for the purpose of approximation. The difference between 58 and 59 isn’t relevant when we’re after a ballpark answer. There’s a lovely Hindi phrase for this — unees-bees ka farak — which literally means ‘(ignoring) the difference between 19 and 20’, and is used to convey an approximate result. Every number in this post is unees-bees ka farak.)
If all the ice that Greenland lost in 2019 were stacked over Manhattan, it would reach a height of 10 km (~6 miles, or 3000 stories). Here’s what this would look like.

This is taller than Mt. Everest, which stands under 9 km tall. Personally I find this astonishing — it’s two orders of magnitude larger than my guess.

Strategy 3: Divide by Another Big Number
This is my favorite strategy for dealing with big numbers. In fact, we already used this strategy above when dividing the volume of Greenland’s lost ice (a big number) by the land area of Manhattan (another ‘big’ number).
The reason we ended up with such a massive height is that Greenland lost a lot of ice, and the area of Manhattan is not very large. If instead we divided by the area of California, we’d end up with a height of 1.5 meters (or 5 feet). Greenland lost enough ice in 2019 to cover California to a height of 5 feet.
What are some other big numbers we could divide by?
How about the number of people on Earth? If we divided the ice Greenland lost in 2019 between the 7.8 billion people on the planet, each person would end up with 580 billion / 7.8 billion ~ 74 cubic meters ~ 2,600 cubic feet.
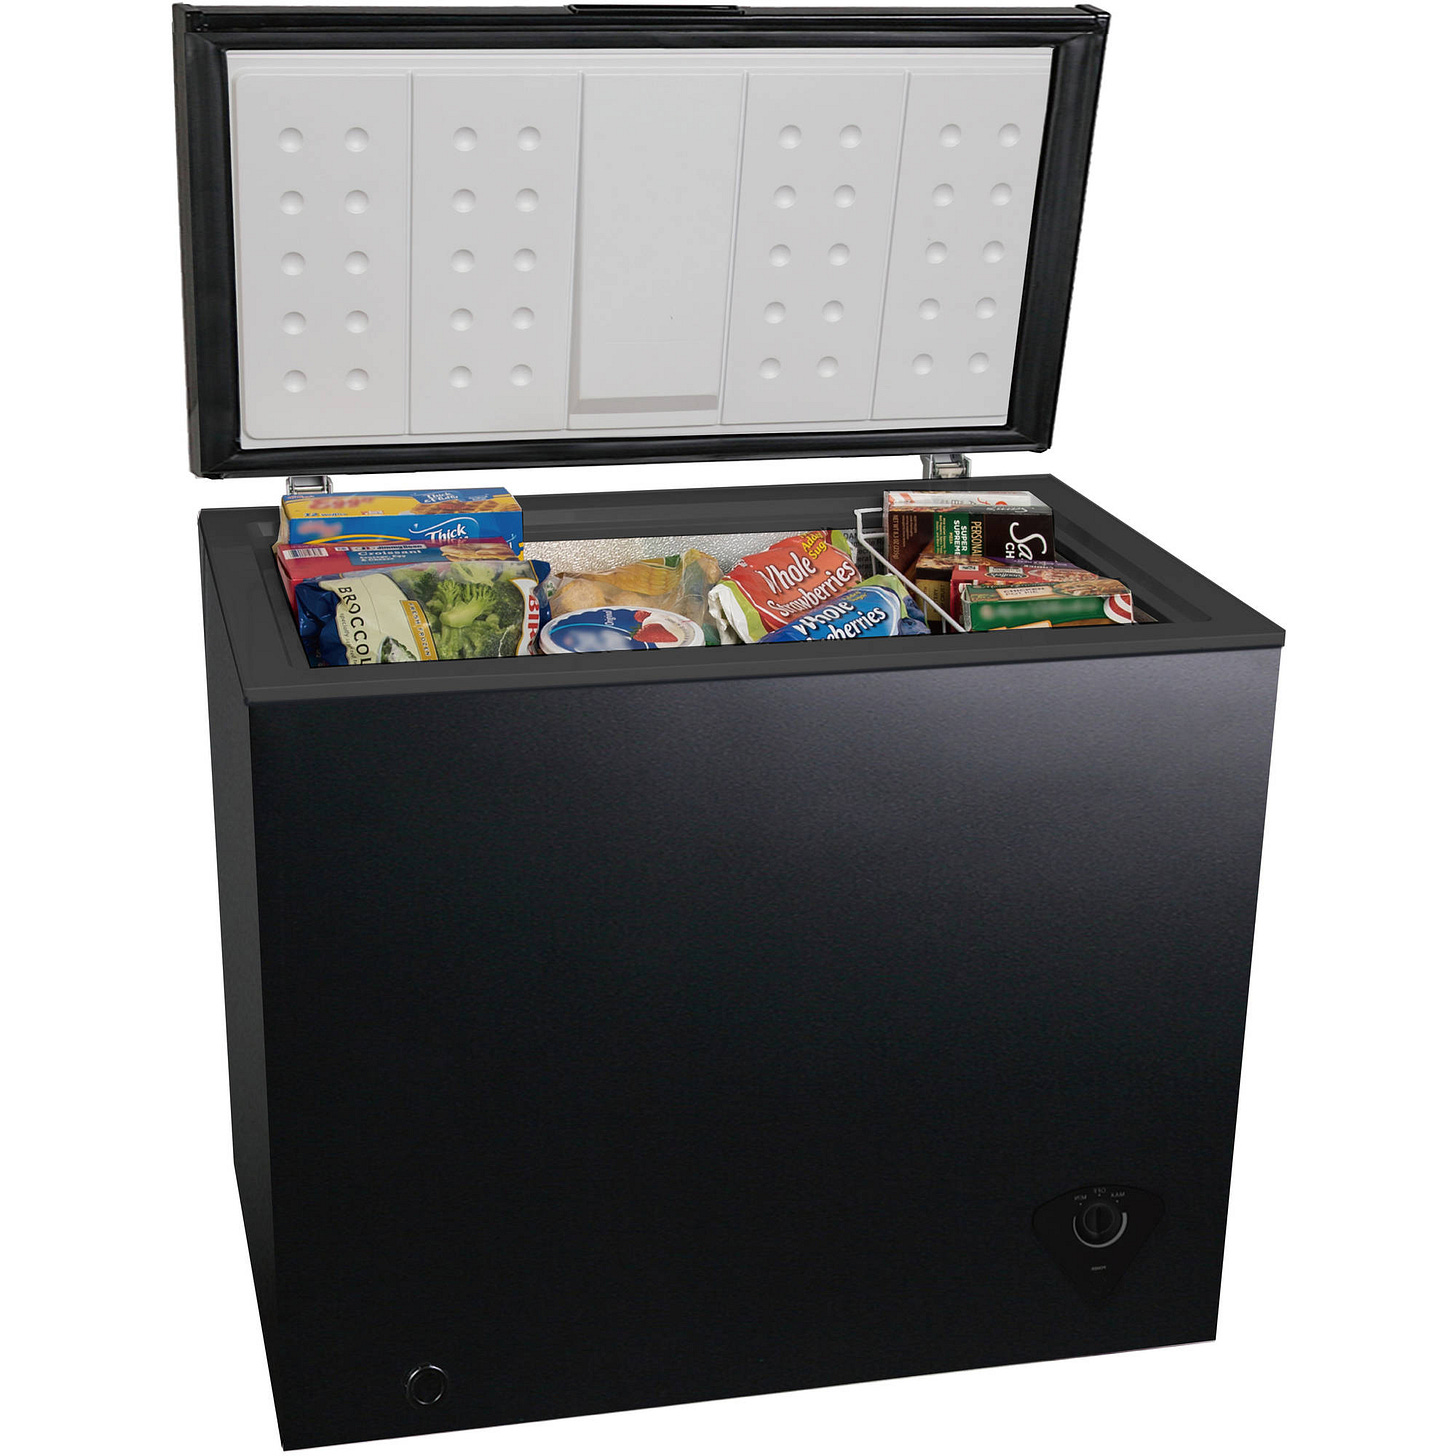
Hmm, that’s still a pretty large number, so let’s divide it again, this time by the number of days in a year. That gives 2,600 / 365 ~ 7 cubic feet, which happens to be the volume of this freezer. (Mini-tip: sometimes you get lucky just by Googling for an awkward number, as long as you provide units.)

So Greenland’s 2019 ice loss, when divided among everyone on Earth, comes out to a freezer’s worth of ice per person per day. By dividing a large number by another large number, we can bring it down to a human-sized number.
Alternatively, another large number you could divide by is the number of minutes in a year. 1 year = 365 * 24 * 60 minutes = 525,600 minutes. (Or just remember the song from Rent.)

So the rate at which Greenland lost ice in 2019 is 580 billion cubic meters / 525,600 minutes, which is a bit over a million cubic meters per minute.
As it turns out, a million cubic meters happens to be about the volume of the Empire State Building. So in 2019, Greenland lost around 1 Empire State Building worth of ice every minute.
That’s a lot of ice.

Empire State Building 3D Model by Thomas De Rivaz
To recap: when faced with a big unfamiliar number, first express it in familiar units, and then find ways to divide it down to size. Keep going, until you get to something that’s small enough that you have a relatable comparison for it. You’ll sometimes see this strategy used in news coverage. For example, this story divides Greenland’s ice melt by the area of the UK. And this one divides it by the seconds in a year (and yes, even expresses the result in that classic science-writing cliche: Olympic-sized swimming pools. If you’re curious, the answer comes out to 7 swimming pools per second).
Thanks for reading! You can find me on Twitter and support my work on Patreon.


Loved this, Aatish!
The snowball is to BIG to STOP and it is going faster and FAster and FASTER!!! the ONLY Solution is found at JW.ORG