This is the third part in a series breaking down the fundamentals of climate science. Here’s Part 1 and Part 2.
To predict how much the world is going to warm in the future, one of the key numbers to understand is Earth’s climate sensitivity. This is the answer to the question: how much will Earth’s temperature rise if we double carbon dioxide levels?
It turns out that this question is as old as the field of climate science. In 1896, the Nobel Prize winning Swedish chemist Svante Arrhenius took a creative approach to solving this problem. By cleverly reinterpreting data on the intensity of moonlight, Arrhenius was able to make the first modern prediction of Earth’s climate sensitivity. (If you’re interested in how he did this, here’s an in-depth video.)
Arrhenius’s answer — 5 to 6 ℃ — is on the high end, compared to our current understanding. Today climate scientists predict this number to be between 1.5 and 4.5 ℃. But the fact that Arrhenius was even in the right ballpark is impressive, given that he was working with indirect data, had to fill in many gaps in the theory, and spent an entire year crunching the numbers by hand!
By the time Arrhenius carried out his calculation, it was well known that carbon dioxide was a greenhouse gas (a fact that we owe to Eunice Newton Foote, although typically credited to John Tyndall). This was the basis for his work, which he combined with the then brand-new theory of heat.
However, Arrhenius wasn’t particularly concerned about global warming. His main motivation was to understand why the ice ages happened. By extrapolating forwards from 1896, Arrhenius worked out that it would take thousands of years for humans to double carbon dioxide levels.
Which was a perfectly reasonable prediction to make in 1896, unless of course humans somehow managed to exponentially increase their carbon emissions.
Well… we all know how that turned out.
Today, we’re in the process of actually conducting Arrhenius’s alarming thought experiment. We’re nearly halfway to a CO₂ doubling compared to pre-industrial levels, and our carbon emissions are accelerating.
So it’s easy to see why Earth’s climate sensitivity is an important number to understand. It helps us understand the future.
We don’t really know where our carbon dioxide levels will end up, that depends on the extent to which climate action succeeds. But Earth’s climate sensitivity lets us predict how much warming we can expect to see in different possible climate futures.
A First Attempt at Calculating Earth’s Climate Sensitivity
So let’s take a stab at cooking up Earth’s climate sensitivity. To do this, we’re going to need a few ingredients.
Take One Part Sunlight
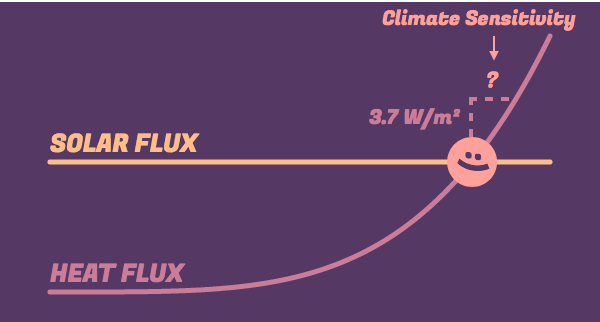
First, we need to know how much sunlight a patch of Earth receives. We’ve encountered this number in previous newsletters — it’s approximately 240 Watts per square meter. We can call this number our incoming energy flow.
The standard term for this quantity is ‘energy flux’. Energy flux = energy / area / time, or the amount of energy absorbed or radiated by 1 square meter of a planet’s surface in 1 second.
This means that one square meter of our planet receives 240 Watts of solar power, on average. I say on average because, of course, day is brighter than night, sunlight is more intense at the equator than at the poles, days are longer in summer than in winter, and so on. This number averages over all these variations.
Also, nearly a third of Earth’s incoming sunlight reflects off stuff like clouds and glaciers — this is known as our albedo (Latin for ‘whiteness’). The number above also takes this into account.
Take An Equal Part Heat
The higher the temperature of any object, the more energy it radiates in the form of heat. In an earlier post, we saw how you can work out a planet’s temperature by balancing the solar energy it receives with the heat that it radiates.

Through this simple balance, we were able to get surprisingly good predictions for the temperature of Mercury and Mars. However, this model falls short for Earth and Venus, because it doesn’t account for the greenhouse effect.
Stick in a Thermometer
To account for the greenhouse effect, we’ll need to know the actual temperature of our planet. Our average temperature is about 15 ℃ (59 ℉), or 288 Kelvin. Once again, this is averaged over the globe, over the seasons, and over day and night.
Yes, we’re leaving out a lot of detail here, but you have to start somewhere. When building a scientific model, there’s always a trade-off between simplicity and detail, and we’re aiming for extreme simplicity here.
The technical term for this type of climate model is a zero-dimensional energy balance model — zero dimensional because we’re only considering global averages, and ignoring the variation at different points on the Earth. The next step up in complexity is a one-dimensional energy balance model, which considers how sunlight, temperature, and ice cover varies with latitude.
Mix in a bunch of CO₂
Finally, we want to understand what happens when we double CO₂. In previous posts, we’ve seen how adding carbon dioxide to the atmosphere increases Earth’s energy imbalance.
Let’s make this quantitative. The IPCC tells us that doubling carbon dioxide will increase Earth’s energy imbalance by 3.7 W/m². This number comes from detailed calculations of how a CO₂ molecule absorbs heat.
You can think of this number as simply being added to our incoming energy flow. To understand what this number means, notice that 3.7 W/m² is about 1.6% of our incoming solar energy flow. So doubling carbon dioxide would have a similar effect on Earth’s temperature as instead making the Sun 1.6 percent brighter.
The technical jargon for this additional energy imbalance is radiative forcing. So climate scientists might say something like “the radiative forcing due to a doubling of CO2 is 3.7 W/m²”.
Now that we have all the ingredients, let’s get cooking.
Set to 288 Kelvin and Bake
Now that we’ve gathered all the pieces that we need, let’s put them together.
Rather than just telling you how this works, I think it’ll be more interesting for you to do it yourself. So I’ve put together an interactive essay that walks you through building a simplified climate model.
It’s called Climate Toy. I hope you find it interesting!

Feel free to drop me a line with your feedback. Did you find this helpful or instructive? Was it confusing? Would you like to see more stuff like this in future? I’d love to hear what you think.
Recent Climate News
You might have heard that Jonathan Franzen published a piece in the New Yorker arguing that a climate apocalypse is inevitable, and that we should stop pretending that we can avert it, and instead focus on taking more local actions.
Here are my 3 favorite responses to this piece:
Ula Chrobak at Popular Science wrote an excellent critique of what the piece gets wrong on climate science and policy.
Mary Heglar wrote a powerful, thoughtful, and poetic response: Home is always worth it.
Kate Marvel wrote an excellent piece on how understanding climate change changes it from a foregone conclusion to a choice.
Trevor Noah asked Greta Thunberg what people can do to act on climate change. Here’s her brilliant response:
“If I were to choose one thing everyone would do, it would be to inform yourself, and to try to understand the situation, and to try to push for a political movement that doesn’t exist. Because the politics needed to “fix this” doesn’t exist today. I think what we should do as individuals is to use the power of democracy to make our voices heard, and to make sure that the people in power actually can not continue to ignore this.”
NYT put together a phenomenal visual explainer showing the extent of the flooding along in the US Midwest and South.
Visualizing the world’s addiction to plastic bottles. This page opens with a gut punch of an animation. The image below, from the article, visualized a years worth of plastic bottles sold next to the tallest building in the world.


TIME highlights 15 women leading the fight against climate change
“We need systemic changes that will reduce everyone’s carbon footprint, whether or not they care.” Michael Mann on how lifestyle changes aren’t enough.
The Washington Post has a great infographic-rich series on the places that have already warmed by over two degrees Celsius.
The UN rights chief on climate change: “The world has never seen a threat to human rights of this scope”


If carbon dioxide hits a new high every year, why isn’t every year hotter than the last?
A map of how every part of the world has warmed – and could continue to warm.
“There are 118 elements on the periodic table. An iPhone contains about 75 of them.” I thought this was a fascinating piece by Maddie Stone on the challenges of recycling electronics.
The US is planning to open nearly 200 fossil-fuel power plants. What’s worse, the article concludes that many of these plants will be more expensive than renewable alternatives.
“An analysis by the Rocky Mountain Institute published Monday looked at 88 gas-fired power plants scheduled to begin operation by 2025. They would emit 100 million tons of carbon dioxide a year – equivalent to 5% of current annual emissions from the U.S. power sector.
The institute calculated the cost of producing a megawatt-hour of electricity of a clean energy portfolio in each state that would provide the same level of power reliability as a gas plant. It determined that building clean energy alternatives would cost less than 90% of the proposed 88 plants.”
Via Brad Plumer: Why did India’s devastating Cyclone Fani kill only 40 people — not 10,000?

Another blow for the future of corals. By Ed Yong in the Atlantic.
Shlesinger and his colleague Yossi Loya have found that three common coral species in the Red Sea have lost their rhythm. Their timing is off; their unison is breaking. Rather than releasing a majestic unified blizzard of eggs and sperm at precise moments, they now spawn in pathetic, erratic drizzles across weeks and months. “It doesn’t look promising for those species,” Shlesinger says.
“This study is heartbreaking,” says Shayle Matsuda of the Hawaii Institute of Marine Biology. “This is something we’ve all worried might be true.”
Global heating made Hurricane Dorian bigger, wetter – and more deadly
Hurricane Dorian may have caused a critically endangered bird to go extinct.
Climate misinformation may be thriving on YouTube, a social scientist warns
Are we overestimating how much trees will help fight climate change?
Global 5G wireless networks threaten weather forecasts
A deeply reported multi-part series on Baltimore’s Climate Divide — how the impact of heating is being felt disproportionately by its most vulnerable residents.
What 500,000 Americans hit by floods can teach us about fighting climate change
To fight global warming, think more about systems than about what you consume. Bill McKibben reviews Tattiana Schlossberg’s new book in the New York Times.


That’s all for this week. See you next time! If you found this newsletter informative or helpful, consider recommending it to a friend. It really helps get the word out. If someone forwarded this email to you, you can subscribe using the button below.


